Background
Advertisers want visibility and reassurance that their media investments will deliver, even more so in recent years. The world has evolved dramatically, with events such as the Brexit, wars, the costs of living crisis, and the Covid pandemic shaping the way we behave. In the same way consumption and behaviour has evolved, businesses have been required to adapt. As a result, it’s a good moment to look at how different media channels offer variable returns. Navigating media investments may seem like a challenge, and although guarantees aren’t available, guidance is.
It’s in this context that we have once again overhauled and updated the vast econometric data that sits behind the Media Mix Navigator, our free media mix allocation tool.
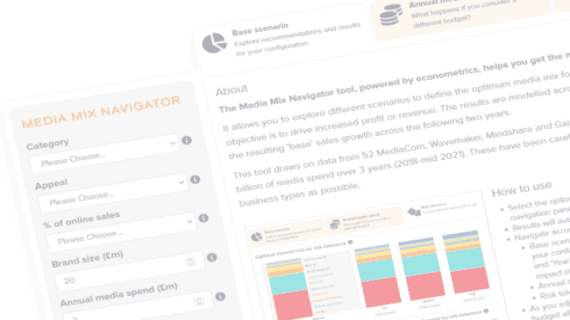
The tool gives an idea of the optimal media plan and the likely return you should expect given the context of your specific business. It’s designed for those without their own econometric analysis, or as a benchmarking device for those with.
The tool was first launched in 2019. But a lot has happened since then, the pandemic being the largest factor, and it needed to be brought up to date. Powered by the Profit Ability 2 databank, it now covers campaigns exclusively from 2021 to 2023, and totalling £1.8 billion of media spend across 141 brands.
So what does the new data tell us?
Findings
Profitability varies by sector
Analysis of the Profit Ability 2 databank shows that advertising generates a profitable return in all sectors, however Profit ROI varies greatly by sector. When looking at short-term profitability, advertising’s Profit ROI for Retail (large) was £3.15 per pound invested – nearly triple that of Travel (£1.19). The variance in ROIs is explained by nuances in the different business environments for each sector – such as the value of products, operating margins and the relative sensitivity of each category to the impact advertising has on sales. The Media Mix Navigator offers the opportunity to produce bespoke runs for your sector.

Profitability varies by media channel
Not all channels are equal, this is made evident by the varying levels of Profit ROI driven in the short term by different channels.
Analysis of the Profit Ability 2 databank proves that advertising is a driver of business growth. All channels analysed in the study delivered a profitable return from advertising. The chart below shows that overall view by channel of profitability, where each channel is mapped using a bubble, with the size representing how much profit is driven. The chart is also split at a Profit ROI of 1, where anything above this line is profitable.
When looking at short-term effectiveness (return within 13-weeks of advertising), advertising has an average short-term Profit ROI of £1.87 per pound invested. Linear TV accounts for 33.9% of short term advertising generated profit across all media types, with an average short term Profit ROI of £1.82.

There are safer waters to swim in
Risk and return is likely top of mind in most areas where people or businesses are making investment decisions. It should be an important consideration for advertisers when identifying the optimal media mix.

This chart displays the latest data on the variability of returns by channel. Low variability means that this channel is more likely to return a predictable ROI (less risky), whilst high ROI variability means the opposite (riskier).
It’s worth noting that high variability works both ways: there’s the possibility of achieving a much higher than average ROI, as well as a much lower one. Using this data can help planners and CMOs discuss their attitudes to risk for a given media plan and adjust accordingly.
So the question is what matters more: higher confidence in a certain result, or the potential for a higher return with the risk it may backfire?
The Media Mix Navigator takes this into account, and enables users to explore four different risk options ranging from very low to high and the subsequent impact on the optimum media mix.
In summary
The databank behind the updated Media Mix Navigator, and the guidance it provides, hopefully offer advertisers some reassurance in their planning decisions. It will help them make the evidence-based business case for continued investment in advertising, and how to mitigate risk, while costs come under even greater scrutiny.
 Thinkbox

